DLSF11
THRU
DLSF18
1 Amp Glass
Passivated Super Fast
Recovery Rectifier
50 to 600 Volts
Features
·
High Surge Capability
·
Low Leakage
·
Low Forward Voltage Drop
·
High Current Capability
·
Super Fast Switching Speed For High Efficiency
Maximum Ratings
·
Operating Temperature: -55
°
C to +125
°
C
·
Storage Temperature: -55
°
C to +150
°
C
MST
Catalog
Number
Device
Marking
Maximum
Recurrent
Peak Reverse
Voltage
Maximum
RMS
Voltage
Maximum
DC
Blocking
Voltage
DLSF11
---
50V
35V
50V
DLSF12
---
100V
70V
100V
DLSF13
---
150V
105V
150V
DLSF14
---
200V
140V
200V
DLSF15
---
300V
210V
300V
DLSF16
---
400V
280V
400V
DLSF18
---
600V
420V
600V
Electrical Characteristics @ 25
°
C Unless Otherwise Specified
Average Forward
Current
I
F(AV)
1 A
T
A
= 55
°
C
Peak Forward Surge
Current
I
FSM
30A
8.3ms, half sine
Maximum
Instantaneous
Forward Voltage
DLSF11-DLSF15
DLSF16-DLSF18
V
F
.975V
1.25V
I
FM
= 1.0A;
T
A
= 25
°
C
Maximum DC
Reverse Current At
Rated DC Blocking
Voltage
I
R
5
µ
A
50
µ
A
T
A
= 25
°
C
T
A
= 150
°
C
Maximum Reverse
Recovery Time
T
rr
35ns
I
F
=0.5A, I
R
=1.0A,
I
rr
=0.25A
Typical Junction
Capacitance
DLSF11-DLSF15
DLSF16-DLSF18
C
J
15pF
10pF
Measured at
1.0MHz, V
R
=4.0V
*Pulse Test: Pulse Width 300
µ
sec, Duty Cycle 1%
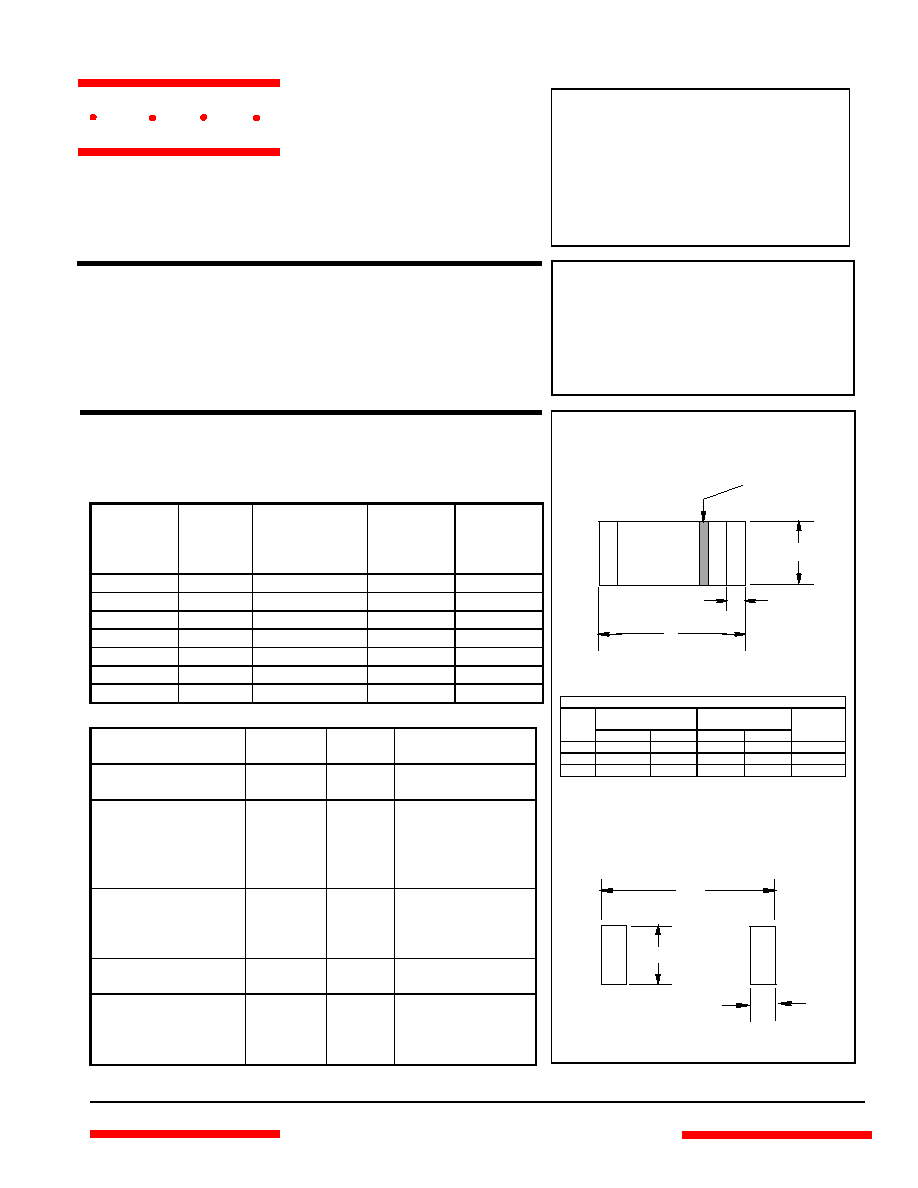
MELF
SUGGESTED SOLDER
PAD LAYOUT
DIMENSIONS
INCHES
MM
DIM
MIN
MAX
MIN
MAX
NOTE
A
.190
.205
4.80
5.20
B
---
.022
---
.55
Nominal
C
.095
.099
2.40
2.50
A
B
C
Cathode Mark
.100"
.026"
.045"
www.
mccsemi
.com
16-18
50ns
omponents
21201 Itasca Street Chatsworth
!"#
$
% !"#
M C C
DLSF11 thru DLSF18
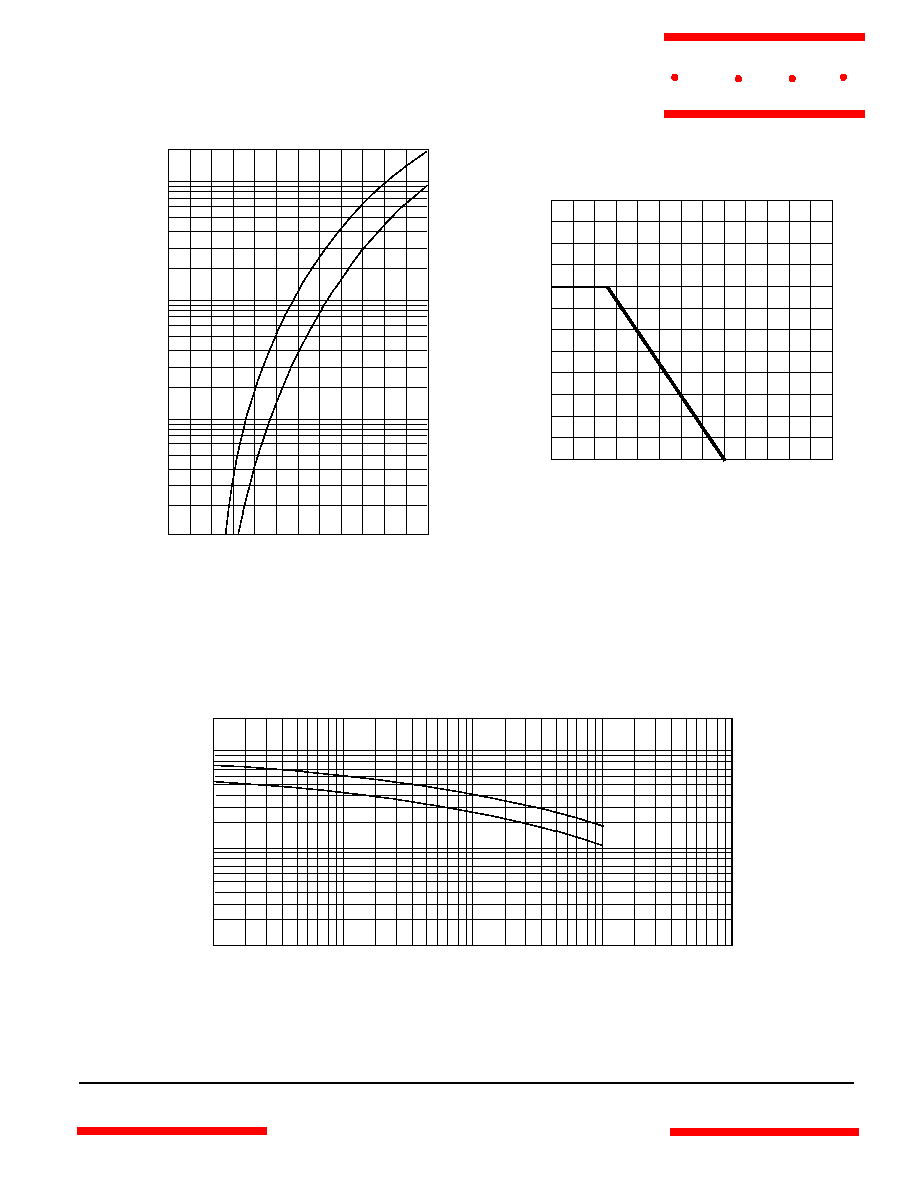
Average Forward Rectified Current - Amperes
versus
Ambient Temperature -
°
C
Figure 2
Forward Derating Curve
0
175
50
75
100
125
0
.25
.5
.75
Single Phase, Half Wave
60Hz Resistive or Inductive Load
Amps
°
C
150
1.0
1.25
1.5
Junction Capacitance - pF
versus
Reverse Voltage - Volts
Instantaneous Forward Current - Amperes
versus
Instantaneous Forward Voltage - Volts
Figure 1
Typical Forward Characteristics
4
6
20
10
Amps
.4
.6
.8
1.0
1.2
1.4
.01
.02
.04
.06
.1
.2
.4
.6
1
2
25
°
C
Volts
Figure 3
Junction Capacitance
.1
.2
1
.4
2
10
20
40
4
100 200
1
2
6
10
20
100
pF
Volts
60
40
4
400
1000
T
J
=25
°
C
SF11 - SF15
SF16 - SF18
SF11 - SF15
SF16 - SF18
M C C
www.
mccsemi
.com

DLSF11 thru DLSF18
t
rr
+0.5A
0
-0.25
-1.0
1cm
Set Time Base for 20/100ns/cm
25Vdc
1
50
10
Oscilloscope
Note 1
Pulse
Generator
Note 2
Notes:
1. Rise Time = 7ns max.
Input impedance = 1 megohm, 22pF
2. Rise Time = 10ns max.
Source impedance = 50 ohms
3. Resistors are non-inductive
Figure 6
Reverse Recovery Time Characteristic And Test Circuit Diagram
Figure 4
Typical Reverse Characteristics
Instantaneous Reverse Leakage Current - MicroAmperes
versus
Percent Of Rated Peak Reverse Voltage - Volts
Volts
4
6
20
10
µ
Amps
20
120
40
60
80
100
.01
.02
.04
.06
.1
.2
.4
.6
1
2
T
A
=25
°
C
40
60
100
140
T
A
=100
°
C
T
A
=150
°
C
M C C
www.
mccsemi
.com
1
100
4
0
10
5
20
30
8
Figure 5
Peak Forward Surge Current
Peak Forward Surge Current - Amperes
versus
Number Of Cycles At 60Hz - Cycles
Amps
Cycles
2
6
10
20
60 80
40
40
50
60